Following my previous blog on using Swimlane diagrams for analysing incidents and events in the process industry, I wanted to revisit this method and explore its application in the healthcare industry. In this blog, I will demonstrate how Swimlane diagrams can help us understand events, identify gaps, and improve patient safety through a real-life case study.
Swimlane is a tool used to map out a sequence of events in a structured and sequential manner. Each actor or role involved in the process is represented in a designated row, or ‘lane,’ which helps organize actions and interactions clearly. By visualizing the flow of events, Swimlane diagrams enable analysts to pinpoint areas requiring further investigation and identify critical gaps.
*If you would like to learn more about Swimlane and how it’s applied in the Process Industry, visit my other blog here.
In this example, we examine an incident that happened in 2015, whereby a cancer patient was exposed to much higher doses of ionising radiation than prescribed during treatment.
Case Study
A patient, LN, was diagnosed with multiple myeloma. Myeloma is a form of cancer that develops in the plasma cells within bone marrow. It typically occurs in areas like the spine and hips. The treatment prescribed to the patient was a 400centiGrays (cGy) of ionising radiation (in two 200cGY beams) for 5 consecutive days.
To deliver the treatment, radiographers use a treatment machine, known as Linac. The correct number of Monitor Units (MU) must be calculated to ensure that the patient receives the right dose. This is a manual process using information from a depth-dose table by a radiographer.
In this case, Radiographer A made an error when calculating the required MUs and wrote the wrong calculated value. Another radiographer, Radiographer B, then carried out an independent check on the calculation as part of the hospital’s protocol. However, Radiographer B made a similar error and came to the same conclusion as Radiographer A.
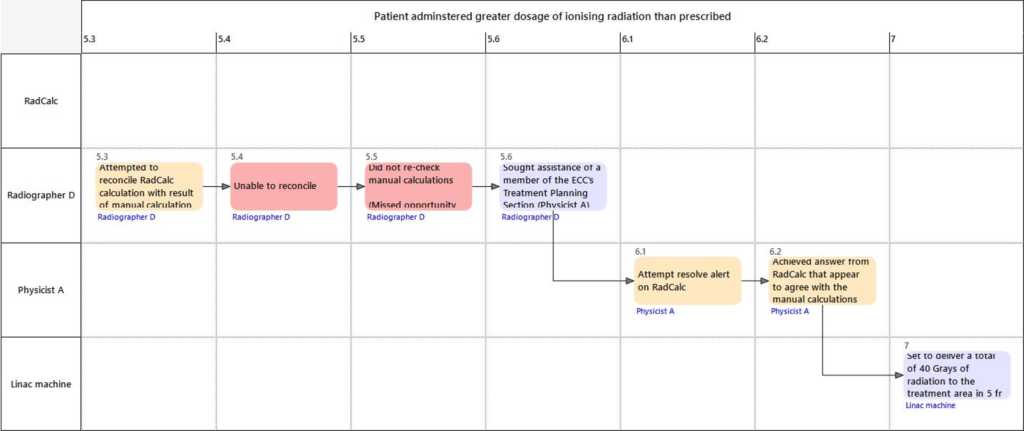
Once the MUs was calculated, Radiographer C entered the erroneous information into an online system called Aria, which then transfers the information to a dose calculation programme called RadCalc. RadCalc alerted there was an incorrect calculation, and another radiographer (Radiographer D) tried to reconcile the manual calculation with the one on RadCalc but failed. As per the hospital’s practice, Radiographer D sought assistance from Physicist A, who was a member of the Treatment Planning Section. Physicist A managed to achieve an agreed answer from RadCalc against the wrong MU value. As a result, Linac was set to deliver twice the prescribed amount, leading to LN being overexposed with ionising radiation.
Constructing a Swimlane from the event
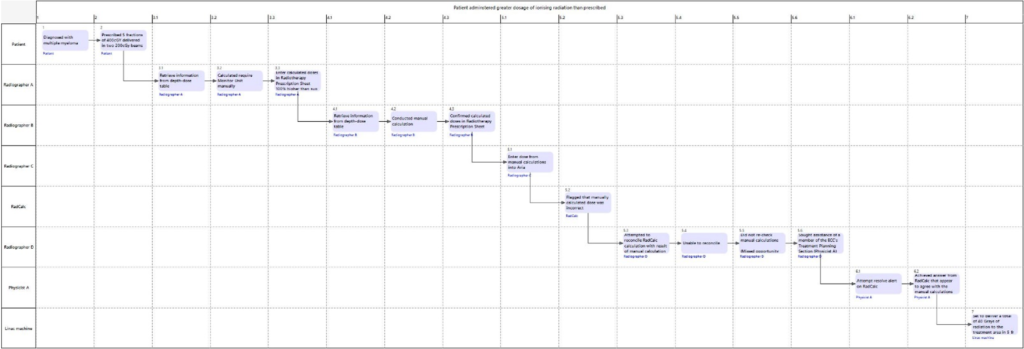
Using the information from the report, we created a Swimlane diagram to illustrate the sequence of events.

The Swimlane diagram clearly maps the actors and their actions performed, and how it flows from one actor to another. It actions shows how these actions interact and highlight potential areas for analysis.

Identifying lines of enquiries
Independent Checking
The Swimlane diagram allowed us to focus on critical parts of the task that required further investigation. For example, by focusing on the radiographers’ actions, we identified key points where errors occurred and areas of missed opportunities to recover the errors. Radiographer B came to the same (wrong) conclusion as Radiographer A when calculating the required MUs. This second check was meant to catch any potential error made by the first radiographer during the manual calculation. However, because both radiographers had the same error, this prompted us to wonder how this could have happened: How did they conduct the calculations? Was it possible that they were under time pressure to complete the calculation?
Communication gap
There were also questions surrounding the communication between the actors. Firstly, there was no mention of communication between the radiographers after RadCalc flagged the discrepancy. The radiographers also did not reconfirm the original calculation, which could have recovered the error. Finally, were there any cultural barriers such as effective communication practices and time constraints which might have made it difficult to discuss the error among the radiographers?
Using the RadCalc program

Another area that we focused our analysis on was when Physicist A achieved the answer from RadCalc after some calibration. What was the protocol for such cases? Was this a knowledge-based mistake, where Physicist A applied a familiar strategy from similar instances what was unsuitable in this case? If so, what were the possible improvements to help prevent this from reoccurring? Additionally, were there anything on RadCalc that could have prevented this error from escalating further?
Evidently the Swimlane analysis helped us identify several gaps and systemic issues within the sequence of events.
Failure Mode and Performance Influencing Factors (PIF) Analysis
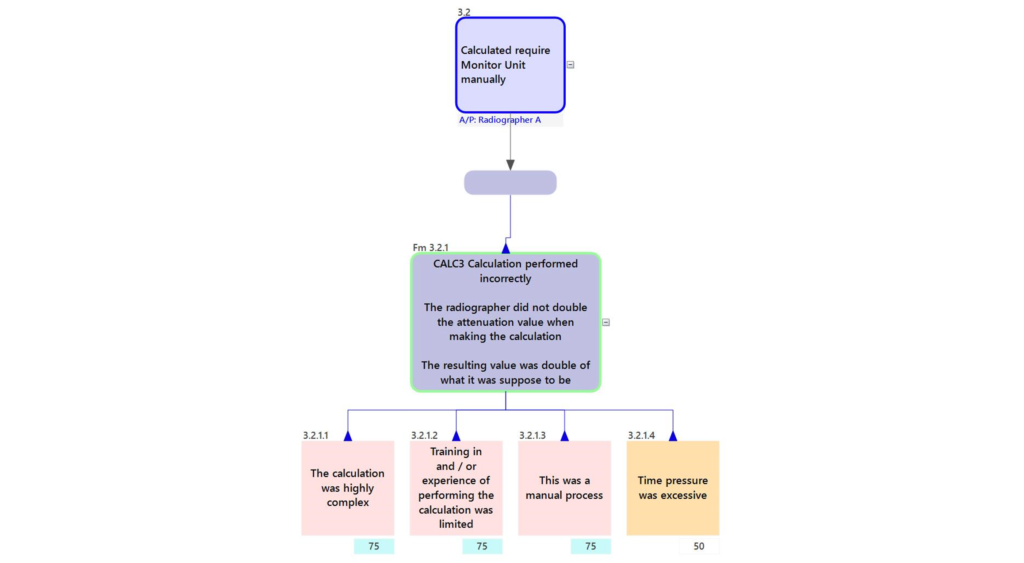
We could also go a step further and conduct a Failure Mode and PIF analysis to understand Using why this error could have occurred and what factors may have contributed to this.

In the screenshot above, we evaluated the other possible factors which could have caused the erroneous MU value. The radiographers could use either of the two methods to conduct the calculation. This makes the calculation complex and therefore could have negatively affected their ability to perform the correct calculation, making it a negative PIF. We also identified some other potential PIFs such as time pressure, training and the fact that this was a manual process. By analysing these factors, we recognise that each of them could potentially play a part in contributing to the errors.
Conclusion
In Human Factors, we adopt a systems approach to incident analysis, looking beyond individual actions to understand how incidents happened. In this example, we used the Swimlane diagram and examined an incident whereby a patient was exposed to increased levels of ionising radiation during their treatment. By showing the event as a timeline, we were able to visualise how the actions interact, identify gaps in the process, and identify possible contributing factors. By taking a holistic approach, we can propose improvements to prevent similar incidents in the future and enhance patient safety in healthcare.
This analysis was conducted using the SHERPA software. If you are interested in understanding how to use Swimlane and conduct human factors analysis, visit our SHERPA page to find out more.
My colleague, Steve, wrote a series of blog on safety culture within healthcare. Click here to read the first part of the blog.


