Swimlane diagrams are powerful tools for mapping out complex processes and are especially useful in incident investigations. In this blog, we will explore how these diagrams can be applied to analyse and understand the events leading to significant incidents.
What are Swimlanes?
Swimlanes, also known as Sequentially Timed Events Plotting (STEP), are tools designed to map out a sequence of events, often across a timeline and between different actors. This is similar to timeline analysis, which also outlines sequences of events over time. However, Swimlanes differ by breaking down events into individual steps populated into different ‘lanes’, which represent the actors involved. Each actor has a designated row, or ‘lane’, filled out with specific actions performed by the agent at a specific point in time during the incident, hence why it’s called Swimlanes.
In incident investigation, it is crucial for the investigator to construct the sequence of events of an incident and understand the various contributing factors. Swimlanes can help this endeavour:
- Swimlanes can be used to map out the incident, build a timeline and confirm the accident sequence.
- Swimlanes can provide a systemic overview of an incident or process by detailing individual actions and their interactions.
- Swimlanes can be used to identify actual and potential active failures in the incident. Active failures can be described as unsafe acts conducted by individuals in direct contact with the task. These could be either slips, lapses, mistakes, or non-compliance.
- Swimlanes also allow analysts to identify possible latent conditions. Latent conditions are conditions hidden within a system that lie dormant before being triggered by an active failure. Some examples are time pressure, fatigue, and inefficient alarm systems.
- Swimlanes can uncover redundancies and bottlenecks and highlight any problematic issues during transitions between lanes.
To illustrate the application of Swimlane diagrams, we will examine the explosion at AB Specialty Silicones in May 2019.
Case study: AB Specialty Silicones Incident
On 3 May 2019, an inadvertent mixing of chemicals at AB Specialty Silicones in Illinois resulted in a massive explosion, destroying the building and fatally injuring four employees.
The site was scheduled to produce two back-to-back batches of a product called Andisil® EM 652 (EM 652). To produce this, the operators needed to mix various chemicals into a tank, including a chemical called Andisil® XL 10 (XL 10) and another chemical called TD 6/12 Blend (TD 6/12).
To produce these batches, the operators followed the order and quantities specified in the batch ticket. These batch tickets act as instructions for the operators and require another individual (e.g., a co-worker or supervisor) to verify the process before signing off the batch ticket.
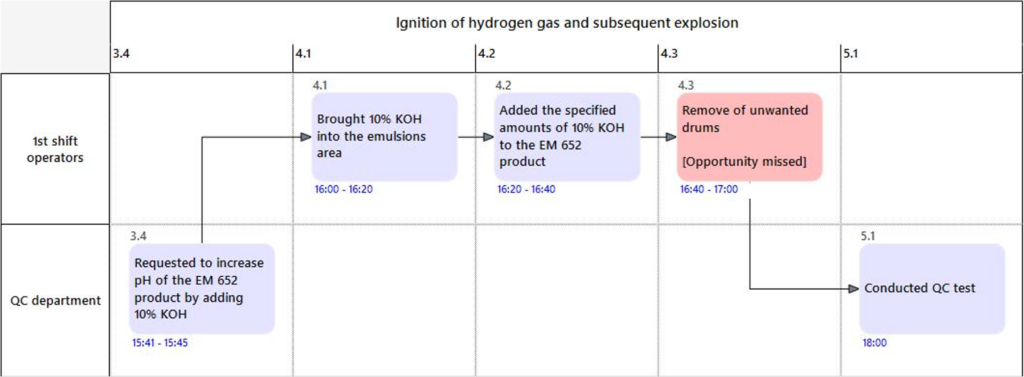
The manufacturing for the first batch of EM 652 began on May 2. The operator printed the batch ticket and added the XL 10 and TD 6/12 in the order and quantities specified in the ticket into the tank. Throughout the process, they took samples to the QC to check the mixture’s pH. It was found that the pH was too low, so the QC chemist issued an order for the operator to increase this by adding specific amounts of 10% potassium hydroxide (10% KOH). The operator then brought a few drums of 10% KOH to the manufacturing area to increase the pH value. By late afternoon of May 3, the EM 652’s pH had finally reached the required specifications, and the first batch of EM 652 was approved for packaging.
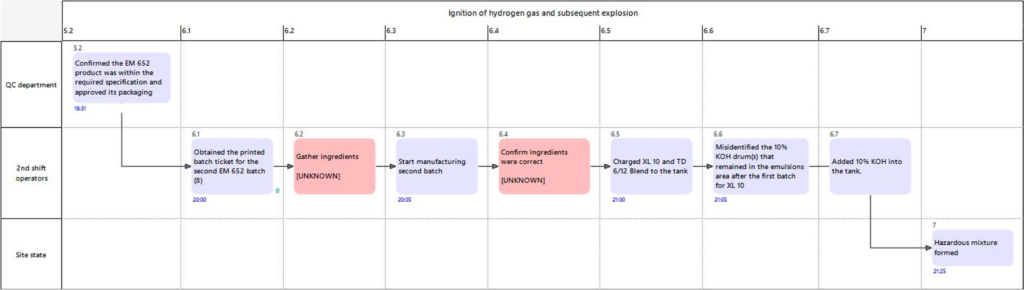
Later that evening, manufacturing for the second batch started. As with the previous batch, the operator printed the batch ticket and added the materials into the tank. However, at some point, the operator mistook one of the 10% KOH drums, which was left there during the previous batch, as one of the ingredients for the manufacturing process and added it to the tank. This led to a chemical reaction that caused the tank contents to overflow and release hydrogen gas. The operators and supervisor tried to ventilate the area. However, before they could successfully do so, the hydrogen gas ignited, causing a massive explosion. These events area reported in the CSB report and video which can be viewed here:
Turning the incident into a Swimlane
We converted the incident into a Swimlane diagram using the SHERPA tool. This involved constructing a Hierarchical Task Analysis (HTA) using the details from the incident and grouping sections of the incident.
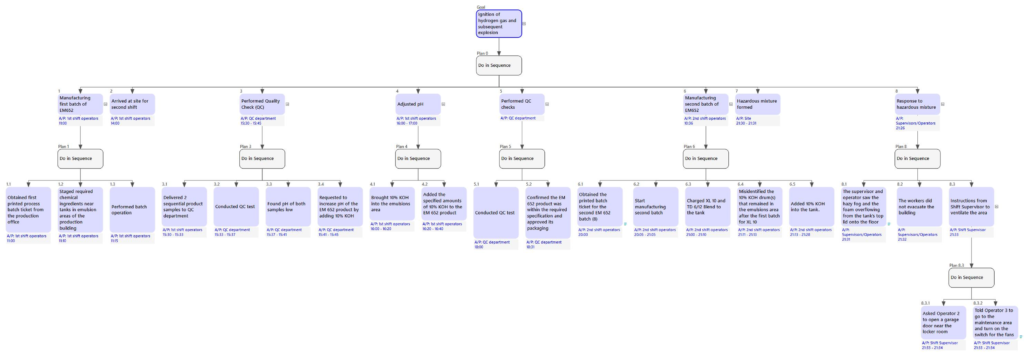
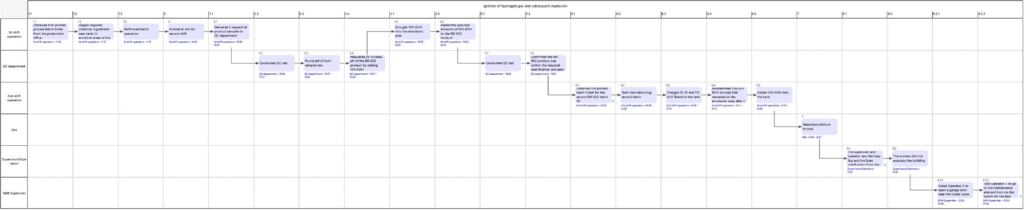
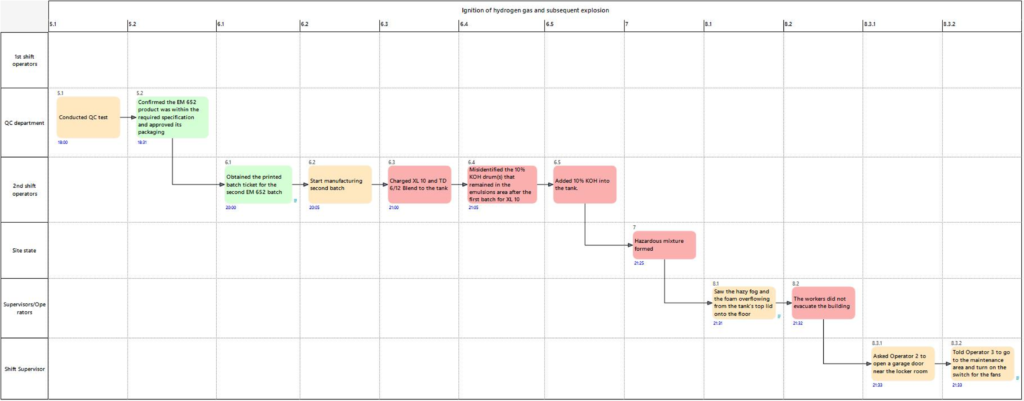
After constructing the Swimlane, we divided the timeline into several phases:
- Precursor events – Activities before the incident that may have created latent conditions
- Initiating events – Activities that may have initiated the incident, often containing active failures.
- Consequences – Results of the initiating events
- Recovery events – Actions taken in an attempt to minimise the consequences
Most incidents follow this pattern, although in some cases, the recovery might be more effective than the others.
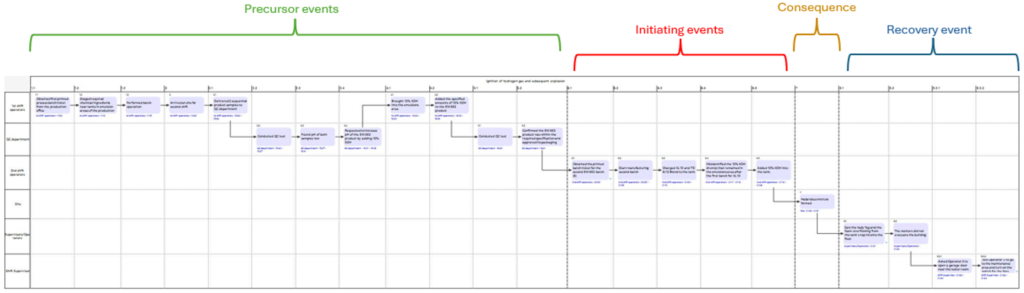
By breaking down the course of events into sections, the information is presented in an easily digestible format, making it an effective tool for summarising events. More importantly, this approach also directs attention to critical areas, prompting questions and useful lines of enquiry.
Identifying missed opportunities
As each lane in the diagram corresponds to a significant state or actor, we can analyse the interactions between these actors. This understanding can help identify the contributing factors of an incident or even challenge the logical flow of the task.
When constructing the Swimlane, we identified several areas of missed opportunities that that could have prevented the incident. For instance, after increasing the pH in the first batch with 10% KOH, the operators failed to return the drums to storage, creating a latent condition for the second batch.
This oversight illustrates a significant contributing factor to the incident. However, while going through the analysis, further questions were raised: Did the second batch operator verify the ingredients before starting the process? Is there a step in the batch ticket that requires the operators to check the ingredients? In the first batch, the operators had to gather the materials near the manufacturing area. Did the second batch operator have to gather the materials too? If that happened, would the operator have realised the extra drums? Moreover, was there any handover between the first batch and second batch operators about the 10% KOH drums left in the area?
Assessing Activity Timings and Overlaps
Additionally, understanding the precise timings of each activity could shed light on overlaps and potential recovery points. The report does mention some timings, however, these are only for significant events. Knowing how long specific steps took could reveal whether these activities conflicted with other critical tasks. We know that in the first batch, the operator added the specified amount of 10% KOH into the mixture. But, what we don’t know is how long this activity took. Were the operators meant to add in a specified amount over a long period of time? Or was this meant to be added once every hour? If the substance was meant to be added at certain intervals, it might have affected the operator’s ability to return the 10% KOH drum, especially if they were also required to bring a sample to the QC department at certain intervals as well.
Example of Failure and PIF analysis
We can also conduct a failure and performance influencing factors (PIF) analysis to understand why the error might have happened. This is crucial in incident investigations as it encourages us to consider the contextual factors that may have affected the operator adding the wrong material during the second batch.
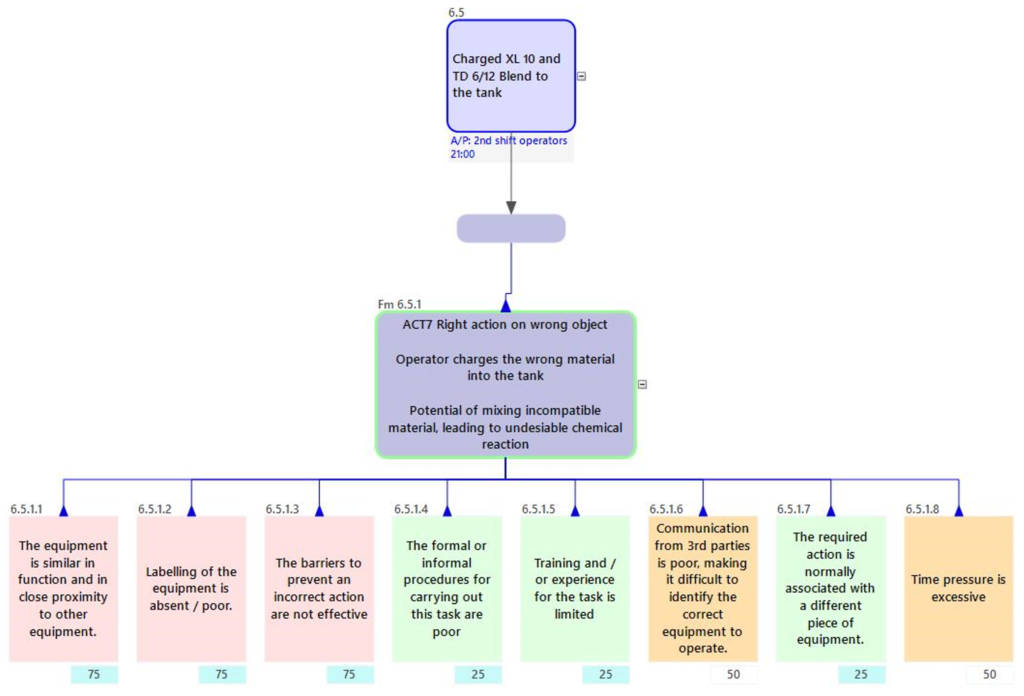
In the example above, we’ve put down “Right action on wrong object” as the error. The boxes below are some of the PIFs that may have affected the second batch operator’s performance. The red boxes represent the negative PIFs, while the green ones represent the positive ones. It is worth noting that most of these were assumptions that were made while reading the report. In reality, this would be done as a discussion with the other stakeholders.
Each PIF in the PIF library represents a different line of enquiry by investigators.
We have also included two potential PIFs, communication and time pressure, in the analysis as both these PIFs relate to the questions raised during the Swimlane analysis. This further highlights the fact that both communication and time pressure may have played a role in the incident.
In conclusion, Swimlane diagrams are great tools for dissecting events leading to an incident. In the AB Specialty Silicones case study, the Swimlane diagram highlighted the key interactions between the first and second batch operators and how these interactions could become latent conditions. By honing in on significant events, Swimlanes prompt analysts to think about the events leading up to the incident, bridging the gap between what happened and why it happened. Such discussions are essential for identifying the gaps in the process, improving the process and preventing the occurrence of similar incidents.
The SHERPA Software was used to map out the incident and create the diagrams featured in this blog.
If you are interested in using Swimlane diagrams for your analysis, download our brochure here or email us at [email protected].
Learn more about Human Factors for Incident Investigation – express your interest in our upcoming Learning from Incidents course.


")